Understanding the True Value of Gann Square of Nine (Gann Sq 9)

Tags

banner-6Gann Square of Nine is also known as Gann Sq 9 or Gann Pyramid, is one of the most important tools in investment of your money at online trading system in anywhere in the world. After getting mastering it is very useful for financial analysis trends.

The Gann square of nice is generally used to confirm the significance of high & low in stock markets also in other types of investments. When you buy a particular stock & how much to pay others. Really the Gann Square of Nine makes just not only possible, but also a reality that has also worked for more investors over the past century over the past.

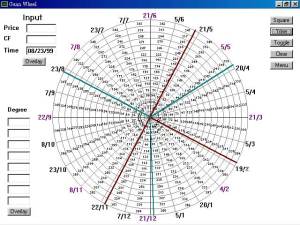
Really Gann Square of Nine should never be used to only choose tops & bottoms when selecting the stocks, but it can be managed to provide additional information to confirm how significant a recent high or low indication in the market trends that was when a break in a trend occurs. Gann Square of Nine (Gann Sq 9) is similar in shape & idea to a wheel or circle, and is generally also referred to as the Gann Wheel.

It starts with the number one in the center & radius out to the first square of 9. It begins from 2 or 1 to left of the corner and then it spirals clockwise to the direction of number 9 in order to form its 1st rotation square of nine. This shifts one unit to the left of nice and the next rotation begins at 10. Further it will continue its spirals to the number 20 and so on.

The Gann Square of Nine is a time and price calculator that figure root of numbers, for both odd & even also their mid points very well. It is also for seek time & price alignments from particular starting point levels i.e. high or low point in a given market.

If you are looking at the numbers that show on the grid that run down to bottom left corner on Gann Square of Nine, you will also find them to be the square root of odd numbers. For example of this would be like 5×5 = 25. If on the other hand, you can look at the numbers that run up well to the top right corner on Gann Square of Nine, you will choose they are square root of even numbers i.e. 4×4 = 16.

Numbers that run down to the bottom right corner will appear you the midpoint between the squares of odd & even numbers. Let’s need to use numbers 25 and 16 mentioned above to illustrate this. At here, the number 21 would represent their midpoint due to it falls exactly between them.

The Gann Square 9 is an arrangement of numbers with a particular order & a used in a number of ways. Further after review of Gann Square of Nine will see you how it will work and illustrate its usefulness in determining market trends highs and lows.

Art of Trading has traded futures & options for one of the largest cash Trading firms in the India. Also currently owns and runs at http://www.artoftrading.co.in

Gann – What You Can Learn from a Trading Expert

Tags

,

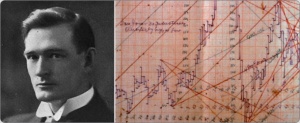
Gann1Hi Guys. Really W D Gann is one of the top class Trader in the world of all time. He has also made $50 million & his genuine method are used by SAVVY Traders in all around the world. If you have not looked at this methods then you should at here’s why?
1 – Sucessful Man – There are more e-selleror traders sell information but further don’t trade or Loss money due to Gann Made Money. His Track record is publically with many of his trades publically documented.

2. Gann Trading Concept – Since Gann was also a technical writer So all technical trader trust him that is present & Future happened.

3 – The method – Actually Gann methods is really based on several dynamic an ideas not only more than his concept of Price and Time.crucial price movements is very important in Trading when price and time coverged. It is noted that when rice & time is not make as union then time always to priority over price.

4 – To quote Gann –  Be remember what has happened in past in the stock market & wall street will happened once again. There was more other innovative an idea including with Fibonacci number sequence, Gann angles and many more but they all do from Gann faith that the market position.

5 – Giving you an Edge for More Money – Keep in mind Gann was not just a write while he was Only trader. Now Savvy Traders all around the world use his method to make more profit through trading at online.

Give your precious time to study Gann & you will get that it will be time very well spent and will give you an edge in your question for more profits.

To know about GANN Techniques Visit us asap

About W D GANN TECHNIQUE – Analyzing the Market Trends

Tags

,

gann3Sir William Delbert Gann ( Late W.D. Gann) was born on June 6, 1878 (at AM 7:00) in Lufkin, Texas. His respected mother Susan Rebecca Gann devoted all her time to her own children and also taught W. Gann with the help of Bible – the Book, which significantly effected his thoughts and views on any kind of financial markets.

gann5

When he has only 16 years old then he leaves the school and works as a seller of goods in trains, works at cotton warehouse. Further he devotes years to markets study and in only 23 years old start working in brokerage company in Texarkana. When he was 24 year, did his first trades in cotton and than moved to New York.

gann4

1908, W. D. Gann invented revolutionary Master Time Factor, with the help of which he forecast market turns to the day. He was also traded two accounts starting with USD 300 and USD 130, which also increased to USD 25 000 just only in 3 months and to USD 12 000 in 30 days. Since than he became known as phenomenal trader.

gann2

1914, Gann predicts the World War and market panics.

In 1936, Gann buys self-constructed airplane Silver Star. He was only the first to own a metal airplane in the United State of America(USA). After in the next few years he buys also more airplanes and speed yacht.

In 1944 he moves to Miami, FL, where he has done continues trading, investing in the real estate and giving courses.

May 23, 1951, Lambert- Gann Publishing Company is established.

1-SP-CNX-Nifty8 (1)

In 76 years old W. D. Gann buys speed yacht and put the names it The Coffee Bean in honour to more successful trade in commodities.This Great Master Course is being sold for USD 5000, which is the great price for average house in 1954. W.D. Gann has left his body at 15:20 June 18, 1955, at the age of 77 years and was buried in the Mason’s section of the Greenwood cemetery in Brooklyn.

A Practical Guide to Visual Chart Trading

Tags

,

Understanding Forex Chart Trading – How to Read an Intraday Chart –

banner-4Chart Trading are many types like intraday Chart. We will discuss in brief about Chart trading for online investments at online.  

What are intraday chart? Intraday Chart of that Chart that have time frame of less than in day or within 24 hrs. It means a 1 Min, 5 Min, 15 Min.60 Min and 240 Min. Charts are all intraday Chart. As well as 240 minute Chart are also known as 4Hour Chart. You can also view these timeframes using a bar Chart or a Candlestick Chart. A bar Chart and a candlestick have some similarities and also some differences. In bar Chart you can see time period like the 1M, 5M, 30M or 240M is also respected with bar. This bar will have small horizontal bar that is represented the open, High, Low, & close of that the time period. There are some patterns is so important   and Day Traders really too much love online Trade them also.

banner-3

A Practical Guide to Visual Chart Trading

Trading Daily Charts in Forex is very Easier, More Fun and More Profitable!

About Chart Trading Techniques the movements of currency prices distinctive formations that are also known as Chart pattern. Trading Technical Chart Patterns with Help of Forex Trend line Tool for better investment in trading at online. There are five most important online trading Chart patterns in presently trading i.e. all of traders should be familiar with as given below.

  • The Wedge
  • Head and Shoulders
  • Channels
  • Descending Triangle
  • Double to

1-SP-CNX-Nifty2 (1) 1-SP-CNX-Nifty2 (2) 1-SP-CNX-Nifty2 1-SP-CNX-Nifty3 (1) 1-SP-CNX-Nifty3 (2) 1-SP-CNX-Nifty3 1-SP-CNX-Nifty4 (1) 1-SP-CNX-Nifty4 1-SP-CNX-Nifty5 1-SP-CNX-Nifty6 (1) 1-SP-CNX-Nifty6 (2) 1-SP-CNX-Nifty6 (3) 1-SP-CNX-Nifty6 1-SP-CNX-Nifty7 (1) 1-SP-CNX-Nifty7 (2) 1-SP-CNX-Nifty7 1-SP-CNX-Nifty8 (1) 1-SP-CNX-Nifty8 1-SP-CNX-Nifty9 (1) 1-SP-CNX-Nifty9 1-SP-CNX-Nifty11 1-SP-CNX-Nifty12 1-SP-CNX-Nifty13 1-SP-CNX-Nifty14 1-SP-CNX-Nifty15 1-SP-CNX-Nifty16 (1) 1-SP-CNX-Nifty16 (2) 1-SP-CNX-Nifty16 1-SP-CNX-Nifty17 1-SP-CNX-Nifty18 1-SP-CNX-Nifty19 1-SP-CNX-Nifty20

Art of Trading will help you any kind of issue regarding Trading with 100% sure best investments on Stock Market in India.

Address –

B 2/17 PHARMA APARTMENTS. 88 I P EXTN, PATPARGANJ, New Delhi, India

Mobile no – +91-9953455454, 09560029528

Visithttp://www.artoftrading.co.in/                                                                 

                       Get Today Update MARKET Trends & Turns of Tomorrow!

Price Time Squaring – Techniques in Market Timing

Tags

art2Hi Guys I want to discuss about technical analysis for forecasting due to more change in market trend Also known as PRICE TIME SQUARING. This is amazing techniques by W.D.Gann.

If you want to start a business get best an idea to start from market low or high prices also to calculate ‘SQUARE’. First of all it means to simply square the cost by multiplying itself then close, but this is not exactly measurement.

In starting to solve for the Time itself by this you can take actually ‘square root’ of the starting price. For example see Weekly Chart of Soybeans Dec 5, 2008.

According to Chart on Dec 5, 2008 weekly price bars is to be Zero then you will start to get 25 price bars on the right side. In Market Timing getting single price bars of major market trend change is to so quite the edge to have.

With anyways, we have now re square & reach about 730. Therefore the first 360 degree levels at 730. The second things will be around 834 & the Third would be 939 etc.

The Market orientation in few ticks of 5th level (1146). On weekly chart, that is really extremely razor sharp.

Some points for about Price Time Squaring, Tech Analysis of Market Forecast, Chart Trading to be remembers as follows –

  • Price Per Square Foot to Determine Home Value is Misguided
  • Hoboken Price Per Square Foot Since Peak
  • Price Per Square For Metal Roof As a Factor in Your Choice of Roofing
  • From Times Square to San Marco Square

“Get Today Update Market & Turns of Tomorrow!”